

- Bus and coach registrations up 13.5% to 1,036 units in September.
- Registrations for the overall bus and coach market remain down 12.8% for the year-to-date.
- Purpose-built buses grew strongly in September, rising 46.4%, but remained down 13.7% over the year so far.
- September registrations were up 11.1% for coaches that were purpose-built and 15.1% over the year-to-date.
- Purpose-built bus and coach registrations increased 40.2% to 429 in the month.
“September was the second successive month of growth for the bus and coach sector, with purpose built buses and coaches recording a rise of more than 40%. While the market is down in comparison with 2012 – given the substantial boost the London Olympics gave to this sector – it is encouraging to see recent monthly rises,” said Mike Hawes, SMMT Chief Executive. “If this rate of recovery continues, we could see volumes for the sector level-off by the end of the year.”
UK bus and coach registrations: 2013 and % change on 2012
|
September |
% change |
Year-to-date |
% change |
Rolling year |
% change |
|
|
Purpose-built single-deck buses <8.5t |
8 |
60.0% |
96 |
-9.4% |
107 |
-7.8% |
|
Purpose-built single-deck buses >8.5t to 12t |
13 |
-59.4% |
213 |
-18.1% |
282 |
-12.4% |
|
Purpose-built single-deck buses >12t to 16t |
179 |
225.5% |
761 |
27.0% |
1004 |
28.4% |
|
Purpose-built single-deck buses >16t |
27 |
-66.3% |
258 |
-38.4% |
325 |
-34.1% |
|
Purpose-built double-deck buses |
142 |
77.5% |
845 |
-25.4% |
1049 |
-30.7% |
|
Purpose-built bus total |
369 |
46.4% |
2173 |
-13.7% |
2767 |
-14.3% |
|
|
|
|
|
|
|
|
|
Purpose-built coaches 3.5t to 16t |
8 |
0 |
43 |
2.4% |
49 |
-27.9% |
|
Purpose-built single-deck coaches >16t |
49 |
2.1% |
614 |
13.3% |
693 |
4.4% |
|
Purpose-built double-deck coaches >16t |
3 |
-50.0% |
46 |
70.4% |
50 |
66.7% |
|
Purpose-built coach total |
60 |
11.1% |
703 |
15.1% |
792 |
3.9% |
|
|
|
|
|
|
|
|
|
Purpose-built bus and coach total |
429 |
40.2% |
2876 |
-8.1% |
3559 |
-10.8% |
|
|
|
|
|
|
|
|
|
*Converted: Bus <3.5t |
109 |
-27.3% |
529 |
-20.3% |
735 |
-6.8% |
|
*Converted: Bus 3.5t to 8.5t |
498 |
9.0% |
2480 |
-16.1% |
2941 |
-19.4% |
|
*Converted: Bus >8.5t |
0 |
0 |
3 |
0.0% |
4 |
0.0% |
|
*Converted bus total |
607 |
0.0% |
3012 |
-16.9% |
3680 |
-17.2% |
|
|
|
|
|
|
|
|
|
*All buses and coaches |
1036 |
13.5% |
5888 |
-12.8% |
7239 |
-14.1% |
* All vehicle manufacturer-built minibus registrations are included in the converted bus <3.5t category.
** All converted bus volumes are counted in the SMMT van and truck news release. These vehicles are also represented here as they form an important part of the UK bus and coach market.
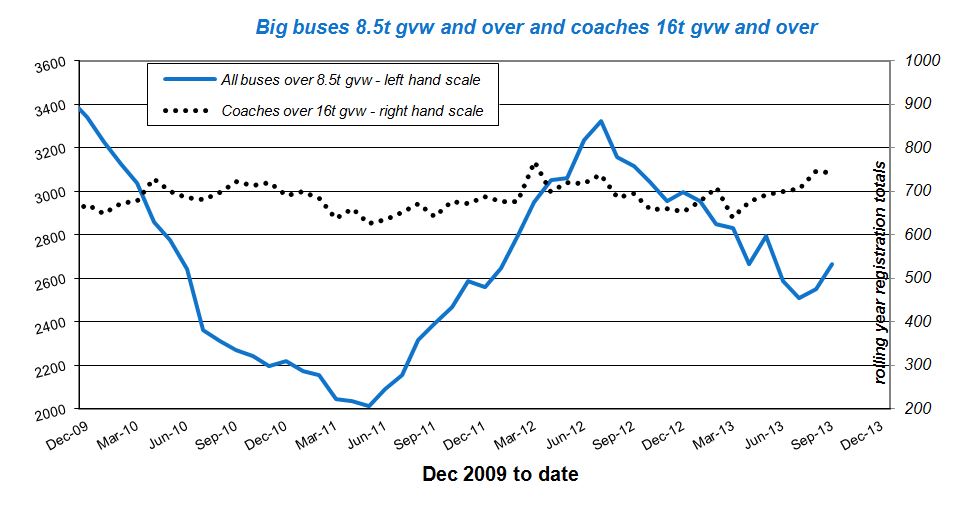
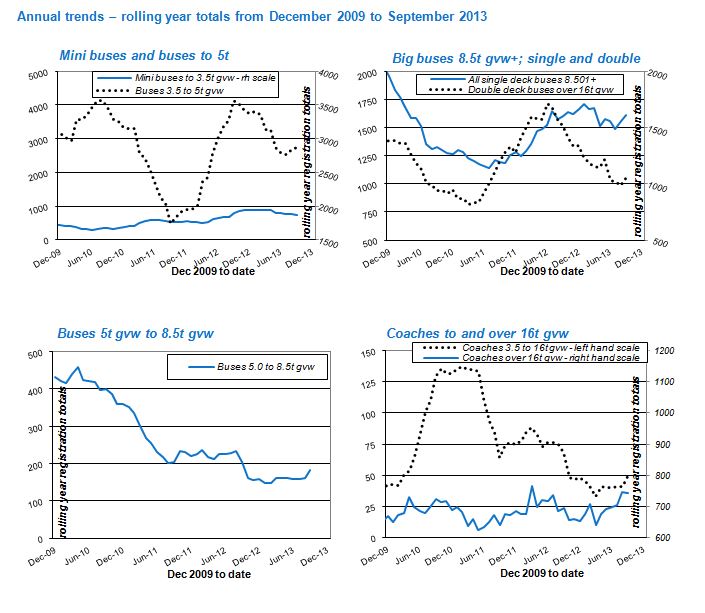
The tables and charts below detail annual trends by gross vehicle weight and type for the whole bus and coach market, taking data from the purpose-built and converted sectors.
Click through to download the September 2013 bus and coach registrations news release and data tables.