Powering the economy
The UK’s automotive industry is one of its most valuable assets, driving economic growth, decarbonisation, trade and innovation, and supporting jobs and prosperity in every region of the country
a catalyst for growth
The automotive sector is a jewel in the crown of the UK economy.
Creating and sustaining high value, high skilled jobs in every part of the country, UK Automotive acts as a catalyst for growth. Every job in the sector supports 2.2 jobs in adjacent sectors, from chemicals and steel to finance and advertising, that benefit from a strong automotive industry – and of course, the essential mobility that vehicles provide keeps society and the economy on the move.
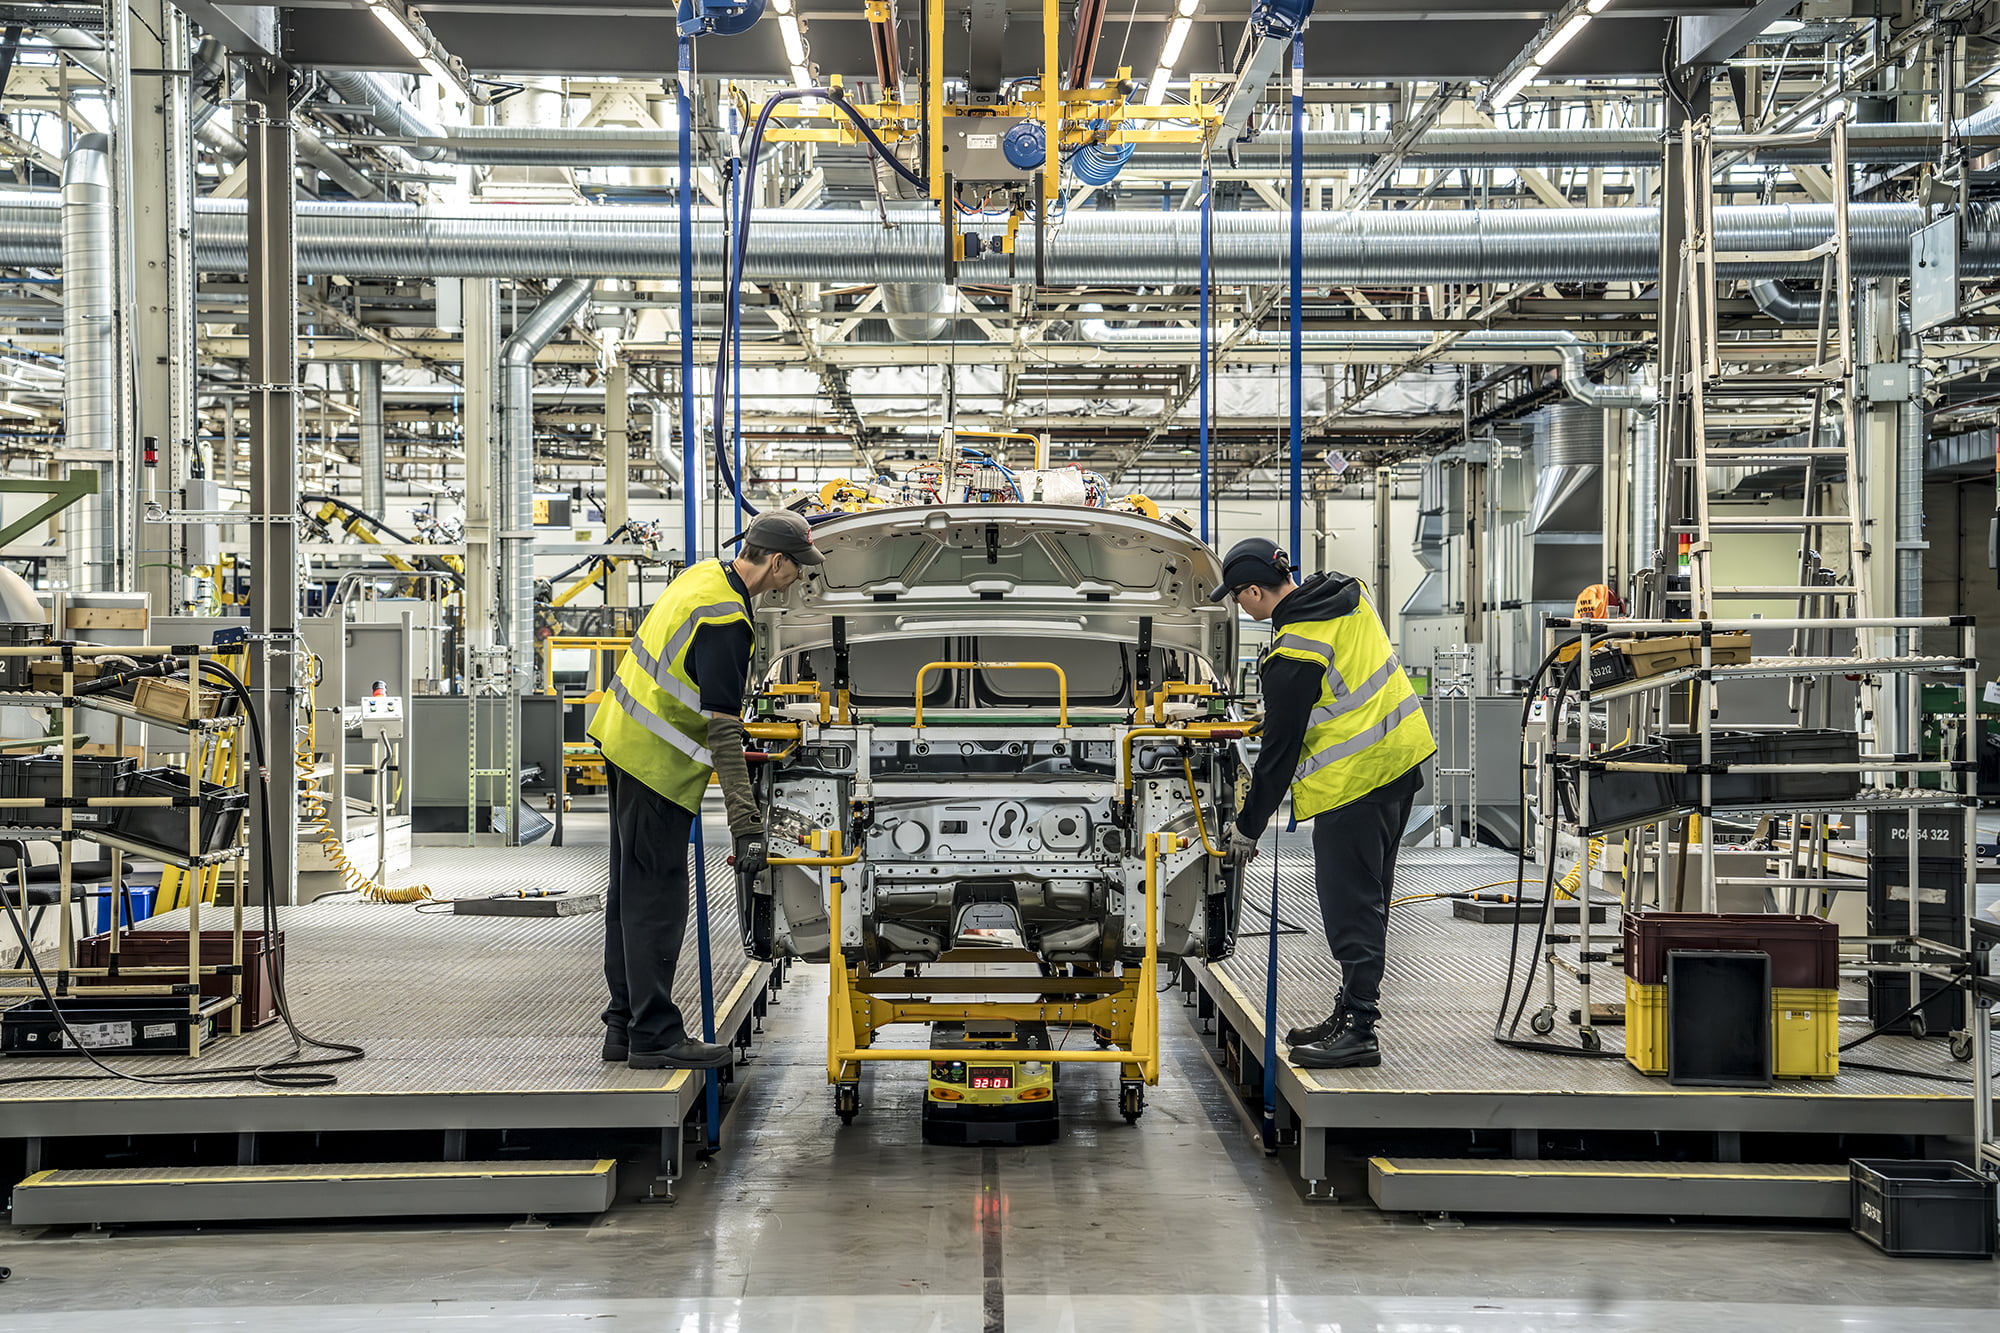
As well as boasting one of the world’s most diverse and varied vehicle manufacturing industries – producing everything from mass market vehicles to high performance sports cars, luxury vehicles, vans, trucks, buses and taxis – underpinning this output are thousands of supply chain and aftermarket companies supporting the entire lifespan of a vehicle.

UK Automotive in numbers
The automotive industry is a vital part of the UK economy
813,000
jobs across the country
198,000
directly employed in manufacturing
£93 billion
turnover
£22 billion
in added value
£47 billion
in exports
12%
of all UK exported goods
-78%
Exhaust emission NO2 down
2nd
Europe’s second-largest car and van market
Economic Analysis
SMMT’s experts provide regular in-depth analysis of the UK automotive industry and its economic impacts, using SMMT’s market leading production and export, registrations and parc data, as well as external data sources such as ONS, HMRC and DFT.
The team produces quarterly outlooks for the new light vehicle markets, while SMMT members also receive a regular Economic Intelligence Update and bi-annual Production Outlook reports.


apply to join
SMMT’s comprehensive membership base covers every aspect of the automotive industry, from vehicles to components, trailers to aftermarket; and from large global corporations to small and medium enterprises. The scope of interest of our members also varies dramatically, ranging from direct, partial or indirect involvement in the manufacturing of vehicles and components, to design engineering and distribution, and a variety of other services aligned to the industry.
Get in touch to find out how to join SMMT.
If you are already a part of an organisation that has an SMMT membership, click here to register your account.
Find out how your company can become a member of SMMT.
"*" indicates required fields