UK Used Car Sales Data
SMMT publishes UK used car transaction data on a quarterly basis. To explore more detailed used car sales data sets and purchase reports, please visit the SMMT DataShop.

SMMT Data shop
To purchase more detailed data visit the SMMT DataShop
Stay Ahead with SMMT’s Used Car Market Data
Understanding the used car market is crucial for staying competitive in the automotive industry. SMMT provides comprehensive data on the UK used car market, including sales figures, market trends, and forecasts. This information helps businesses like yours track how many cars are sold in the UK each year, analyse car sales by model and manufacturer, and understand used car price trends. With detailed insights, SMMT enables members to make informed decisions and effectively plan their strategies. Access the latest used car sales data and stay ahead with SMMT.
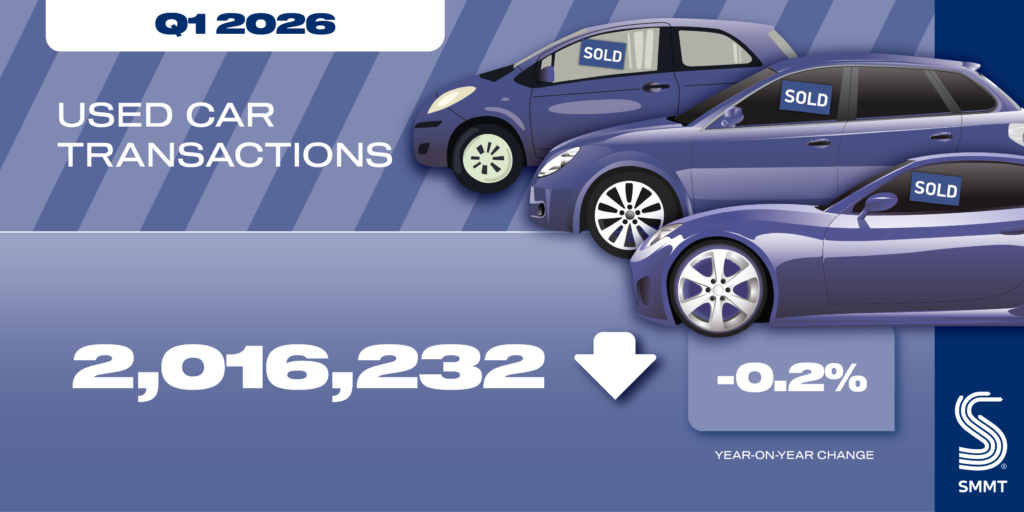
| Q1 2026 | Q1 2025 | % change | YTD 2026 | YTD 2025 | % change YTD | |
|---|---|---|---|---|---|---|
| Total | 2,016,232 | 2,020,990 | -0.2% | 2,016,232 | 2,020,990 | -0.2% |
USED CAR SALES 2020 to 2026
| Used Car Transactions for United Kingdom | |||||||||||||
|---|---|---|---|---|---|---|---|---|---|---|---|---|---|
| Year | Jan | Feb | Mar | Apr | May | Jun | Jul | Aug | Sep | Oct | Nov | Dec | Total |
| 2020 | 696,707 | 672,242 | 482,970 | 177,898 | 330,554 | 530,851 | 744,818 | 725,034 | 698,747 | 715,149 | 519,142 | 458,847 | 6,752,959 |
| 2021 | 507,632 | 541,553 | 638,570 | 724,743 | 769,782 | 672,979 | 708,326 | 682,293 | 643,844 | 653,913 | 575,421 | 411,900 | 7,530,956 |
| 2022 | 597,715 | 581,533 | 595,103 | 603,341 | 608,661 | 547,682 | 608,571 | 614,526 | 562,350 | 607,849 | 548,410 | 415,036 | 6,890,777 |
| 2023 | 619,301 | 606,890 | 620,958 | 613,540 | 626,649 | 592,078 | 646,331 | 640,239 | 597,590 | 626,083 | 586,512 | 466,521 | 7,242,692 |
| 2024 | 650,747 | 653,484 | 663,692 | 669,281 | 672,657 | 621,457 | 668,890 | 669,243 | 627,678 | 669,319 | 607,483 | 469,249 | 7,643,180 |
| 2025 | 659,682 | 651,783 | 709,525 | 672,145 | 689,196 | 634,775 | 693,512 | 678,945 | 648,808 | 674,801 | 606,182 | 488,518 | 7,807,872 |
| 2026 | 670,797 | 652,190 | 693,245 | 2,016,232 | |||||||||
SMMT used car data is derived from information supplied by DVLA, which periodically revises historic data, which can result in variations in data previously reported.
| Make | Model | Total |
|---|---|---|
| FORD | FIESTA | 76,745 |
| VAUXHALL | CORSA | 62,201 |
| VOLKSWAGEN | GOLF | 56,236 |
| FORD | FOCUS | 54,662 |
| NISSAN | QASHQAI | 42,214 |
| VOLKSWAGEN | POLO | 39,159 |
| BMW | 3 SERIES | 37,621 |
| MINI | MINI | 37,438 |
| VAUXHALL | ASTRA | 35,340 |
| BMW | 1 SERIES | 32,363 |
| Region | Total |
|---|---|
| SOUTH EAST | 292,545 |
| NORTH WEST | 222,997 |
| WEST MIDLANDS | 207,765 |
| EAST | 194,898 |
| SOUTH WEST | 185,473 |
| YORKSHIRE AND HUMBERSIDE | 182,360 |
| EAST MIDLANDS | 161,809 |
| SCOTLAND | 159,865 |
| LONDON | 147,334 |
| WALES | 107,408 |
| Colour | Q1 |
|---|---|
| BLACK | 429,392 |
| GREY | 376,124 |
| WHITE | 331,409 |
| BLUE | 318,100 |
| SILVER/ALUMINIUM | 259,424 |
| RED | 197,170 |
| GREEN | 36,862 |
| ORANGE | 15,565 |
| YELLOW | 10,820 |
| BROWN | 9,741 |
| Fuel | Q1 |
|---|---|
| PETROL | 1,147,969 |
| DIESEL | 629,987 |
| HYBRID | 128,039 |
| ELECTRIC | 86,943 |
| PLUG-IN HYBRID | 20,021 |
Data download
Q1 2026 used car data
SMMT Update
Sign up to the SMMT Update Newsletter for weekly automotive news and data
"*" indicates required fields